Hi all.
In early February this blog tracked, day by day, the spread of the situation in China and whether containment measures were working to confine the largest spike in that country to Hubei Province, and whether containment measures were working to confine the majority of cases to China. Initially, this later effort looked successful, and the Chinese response seemed to be working. By February 24th, the data seemed clear that while the effort inside China had been a remarkable and unprecedented success, the situation outside China was not contained and a pandemic was inevitable. I wrote:
Hence, COVID-19 seems likely to become a pandemic.
I expect that most people will begin referring to it as one within the next two weeks.
Pandemic – 24 February – Rank Amateur Epidemiology Hour
On March 11th, the World Health Organization officially declared the situation a pandemic. A careful reader will notice this was two weeks and two days later, so I guess I did miss my guess.
The entire globe has started discussing the pandemic and in many cases have started taking action to prevent it. It’s widely recognized that what we’re facing is a once-in-a-century pandemic. Now that we’re all on the same page, there hasn’t been much reason to post here. There’s better sources of data and all kinds of interesting analysis to read elsewhere, if that’s something you’re looking to find.
So why this post?
Well. There are still a few projections that are clear to anyone running statistics on the current data, but aren’t heavily discussed yet. The first is the fatality projections. A few studies have alluded to them, but there’s not many people who are outright publishing projections. The second is that the current data is showing that what happened in Wuhan was much more gentle than the exponential curve that we’re facing globally now. Epidemiologists clearly have done the math on both these, but it’s not always obvious from their reports. I think mostly because as a group, epidemiologists tend to be a bit conservative about extrapolating into the future. Their field places a large weight on not scaring the public and maintaining public trust, which can sometimes conflict with being forthcoming about a scary trajectory. Another major reason this isn’t being as widely discussed is because our public health policies are actively designed to make sure that none of these projections ever become true. The work of almost every epidemiologist engaged in this effort is designed to avoid the future the statistical projections show. And the history of epidemiology shows they typically succeed.
Since I’m not an epidemiologist, I’m just going to talk about what my model says about the curve we’re on. And why I hope it’s wrong:
The Past
Two to three weeks ago, the question I was frustratedly asking people who were convinced that this would not be that bad was: “Why do you think what happened in Wuhan won’t happen here?”
It’s become apparent that I was too much of an optimist.
Here’s the graph from the posts in February when the updates on this blog tracking the rate of acceleration of the reporting cases of COVID-19 in various subgroups each day. This was when the rate of acceleration for the confirmed case data in Hubei Province was just starting to turn around:
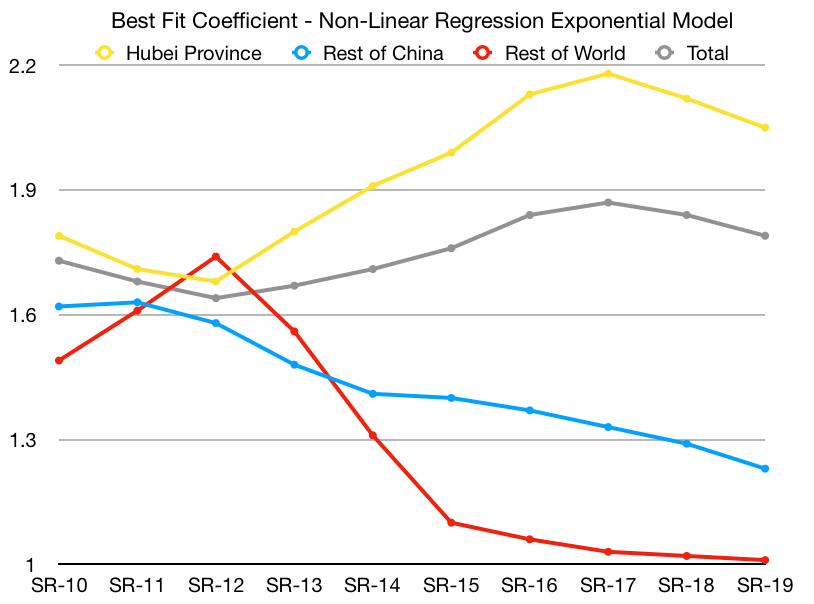
This was the peak of the acceleration of the outbreak in Hubei—and so far in China. Things looked good here. And in what turned out to be excellent news, the situation in Hubei Province and the Rest of China really did improve afterwards. Unfortunately due to significant under-reporting of COVID-19 cases outside China, the Rest of World data was not as good as it looked and things changed sharply later that month. Containment in China had failed and a global pandemic was inevitable.
The Present
It has unfortunately slowly only gotten worse and worse. Here’s what the Rest of World graph looks like now:
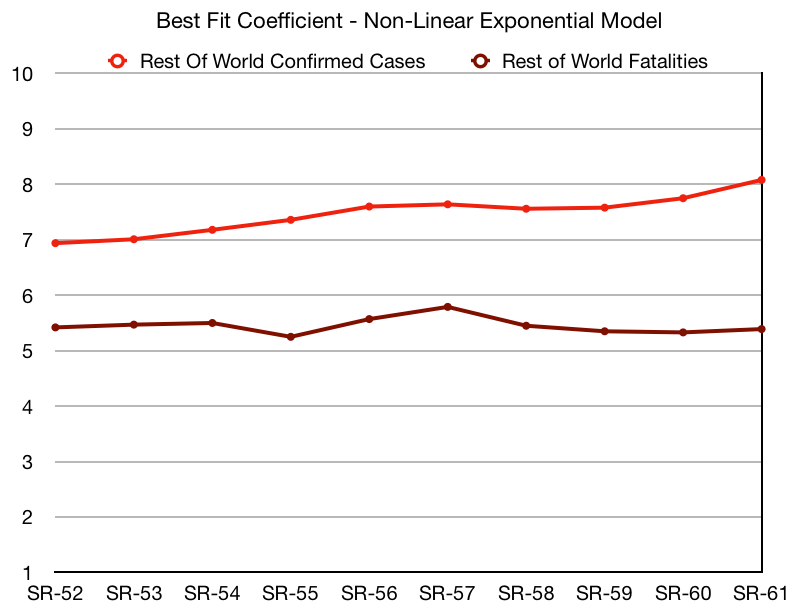
So while the Hubei Province confirmed case projection peaked at an exponential co-efficient of 2.18, the exponential co-efficient we’re seeing in the confirmed case counts in the Rest of World data rose to 8.08 in the latest Situation Report from the World Health Organization. This means the exponential curve we’re on globally is much worse than the curve Hubei was on.
So it turns out “Why do you think what happened in Wuhan won’t happen here?” was the wrong question. Wuhan is the optimistic scenario. One Italy is now well past. We will need to do a lot to strive to get down closer to Wuhan’s lower, flatter curve.
The graph above also includes what we’re seeing in the fatality data. There are many who suggest that the current spike in confirmed case count is the rest of the world finally making up for lost time in under-reported testing. Unfortunately the exponential rate of the fatality trajectory is also much higher than Wuhan ever reached. It seems unlikely we weren’t noticing people dying before and are only counting them now. So it’s not just under-reported testing. This trajectory appears to be quite stable, providing increased evidence that there’s a much more rapid acceleration globally than we ever saw in Hubei Province, or in China.
Luckily, the data we’re seeing now doesn’t necessarily reflect our future, but rather our behavior from the past. This is what happened because we in the rest of the world didn’t respond quickly enough and take the pandemic seriously. It is, we fervently hope, not the outcome that will occur now that we’re beginning to do so.
The Future We Hope To Avoid
So given what we’ve been seeing, we have changed our behavior. Many countries and regions in the world are in some form of lockdown, shelter in place, or similar health order. I’m writing this blog post under one. Perhaps we should have done it sooner, but at this point, it’s just a relief to see it being done.
The world is responding. Social Distancing has entered the common vernacular. We are “staying home to save lives”. We are washing our hands. We are not shaking other people’s hands. We are staying 2 meters or 6 feet apart. We are making face masks on sewing machines. We’re doing everything we can to flatten the curve. We’re coining new slogans and graphs and posts daily and each one helps us all understand more and more about why we’re doing this all, and why it’s necessary.
Here’s another take on it:
This is what my model says our future would look like if we hadn’t begun to change our behavior. This is the trajectory we were on:
| Projection | Lower Projection | Upper Projection |
| Half World Population Gets COVID-19 By: | October | August |
| Global Deaths by April 1st | 36,000 | 42,000 |
| Global Deaths by April 16th | 159,000 | 199,000 |
| Global Deaths by May 1st | 516,000 | 684,000 |
| Global Deaths by June 1st | 3,230,000 | 4,670,000 |
If this isn’t the future you want: changing our behavior is required.
If we’re successful, we’ll change this trajectory for the better and see the curve flatten. Our future will be better than the optimistic case in the projections above.
And yes, until we have a vaccine or treatment protocol and the appropriate level of distribution of those interventions, we’ll need to keep doing this for awhile. (Each region will make their own decisions on when to phase movement restrictions on and off, but collectively we’ll all want to be washing our hands a lot better and more than we used to for awhile.)
It’s also possible that we do these interventions and don’t see a significant change in the curve. There’s a lot of countries that haven’t changed their behavior yet. And a lot of countries which haven’t even begun the process of finding the cases they have.
The projections above are why the world must do everything we can to avoid the current trajectory.
