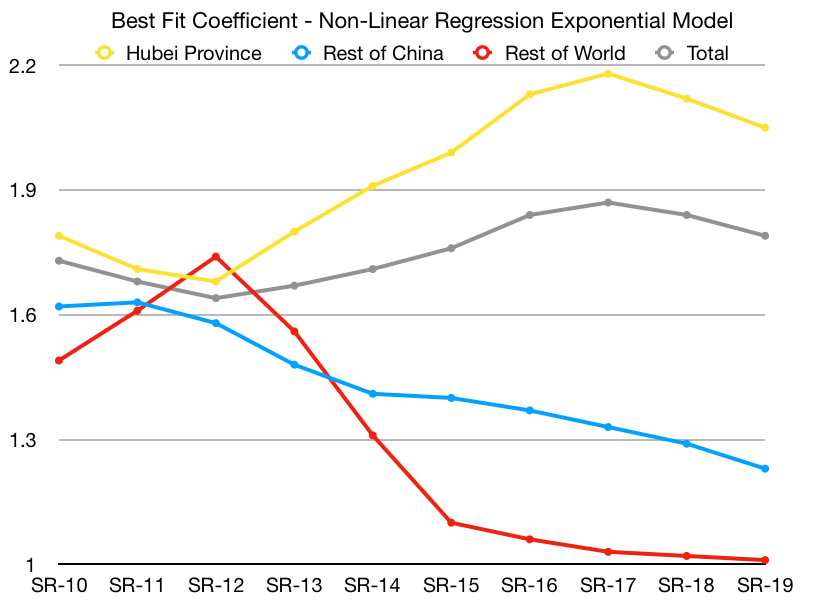
The situation appears to be stabilizing and getting less severe across the entire world:
I think we’ve also likely reached the point where it no longer makes sense to go over these models daily. I’m also not going to list the specific predictions from the fatality model today, (it is still going up and probably will for awhile) since the best available data shows that it is still working off an exponential curve that is likely weeks out of date from the current situation and will not accurately predict much about the future. It should be ignored until we have signal on its accuracy.
Hubei Province
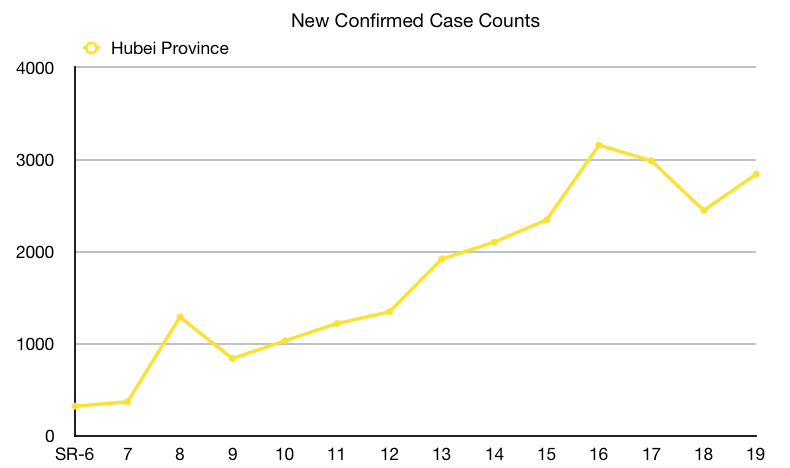
Hubei Province appears to be stabilizing at a linear growth rate. The same three possibilities from yesterday apply:
- Hubei Province is stabilizing and no longer accelerating.
- This is a temporary change. (Less likely than yesterday!)
- The healthcare system for the province is too overwhelmed to accurately confirm new cases as the outbreak scales in size.
It seems, for the moment, safer than yesterday to assume the second situation is probably not what’s happening. New case counts are in the same very rough range for Situation Reports 15-19. This doesn’t appear to be a temporary artifact.
So now we need to figure out whether it’s the first or third situation. This is going to be harder. There’s two ways we’ll be able to figure this out from the data we have:
- We start to see new case counts drop consistently. This would support a break in the outbreak.
- The fatality model a week or two from now hasn’t shown any sign of slowing. The data would then support an idea that we’re not getting accurate confirmed case counts due to an overloaded healthcare system.
On the ground information from Hubei is the other key way we will be able to tell these apart. So that’s something to keep an eye out for in the coming days. In either case, it seems days or weeks before we’ll know much here. The best working assumption until then is probably to assume the outbreak is indeed stabilizing.
Rest of China
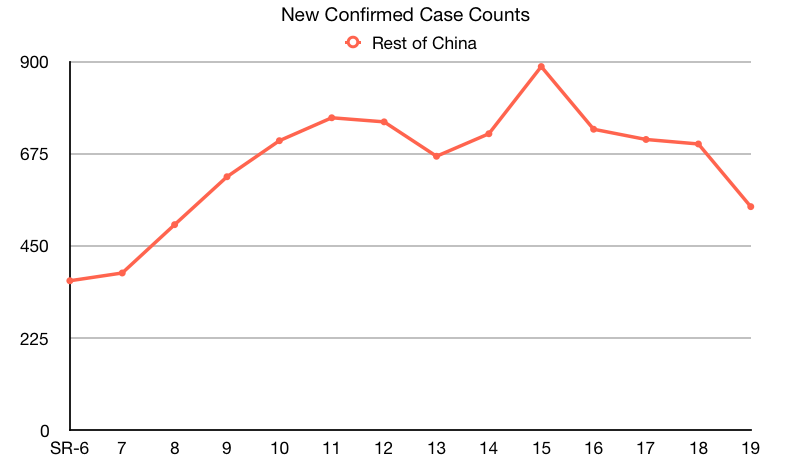
The model continues to show an effective response in the rest of China. That’s it. That’s the post.
Thank a Chinese healthcare professional today!
Rest of World
The past few days this has not seemed like good news. Yesterday’s model looked like this:
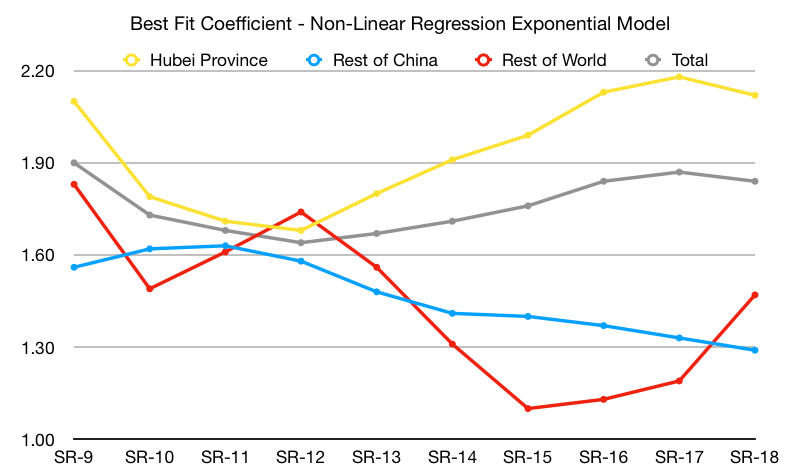
The population we’re talking about in this section is the red line. It definitely doesn’t seem to be going in the right direction, it’s sharply heading up. I was pretty critical about some of the response in this section in the past few days. But yesterday there was a caveat:
This looks real bad. But luckily it isn’t as bad as it looks. The majority of the spike here is from the confirmed case counts from one cruise ship as 41 new cases were confirmed there today. The fact that it happened to be included in the reporting on this day is not really significant. And the situation on the cruise ship seems unique enough to not necessarily say much about how we’re handling the spread of 2019-nCoV elsewhere. After this batch of cases are added to the count, over 20% of all the global cases outside China are on this one cruise ship.
From yesterday’s post
I also noted:
Perhaps in future days we will remove the cruise ship from counting as part of this population
Yesterday’s post
So. I did that today. The cruise ship is only split out in the last three reports, (prior to that it was reported as part of Japan’s cases, since it is in a Japanese port) but looking at the new case number for the split-out group in Situation Report 17, you can split out the group from the case numbers in Situation Report 16 as well. And this is what you get:
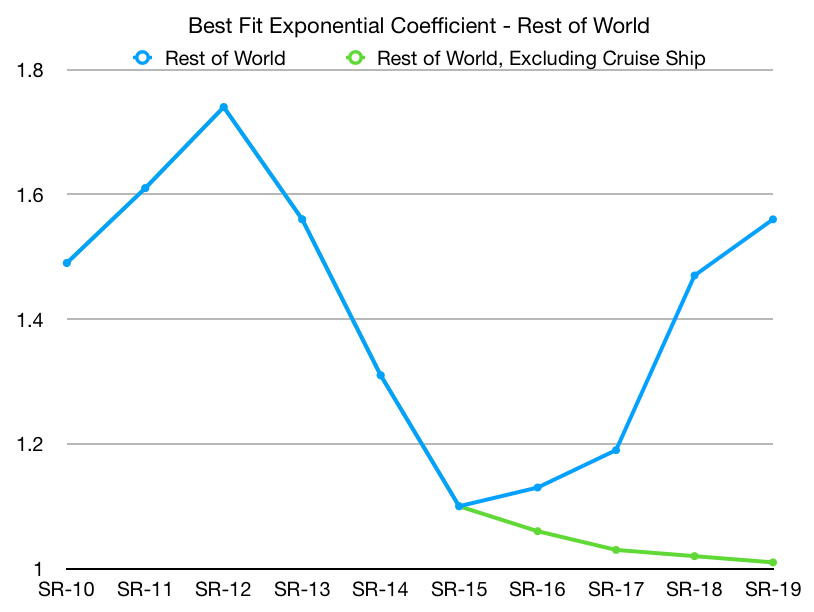
This data shows that excluding the cruise ship, the curve is falling back into the linear domain and is not well predicted by an exponential growth model. Excluding a cruise ship seems like a weird way to go, but given the number of cases on the cruise ship in comparison to the international cases otherwise and the relatively unique situation of a cruise ship, it doesn’t seem right to evaluate the global response of 2019-nCoV based on that data being included either.
It now appears to be much more reasonable to come to the conclusion that the situation outside of China has an effective response and is becoming stable.
Other than the cruise ship, there is one remaining concern, which is some cases in countries without good healthcare systems may be unreported at this time. And may continue to be unreported for awhile until we finally discover a whole cluster. This doesn’t seem like a tremendously likely outcome, but is one thing worth keeping in mind before we completely assume the containment measures have been effective to isolate the 2019-nCoV outbreak to mostly inside of China.
