Today we’re no longer seeing the same day by day trends we saw over most of the past week and are starting to see potential that the models are stabilizing:
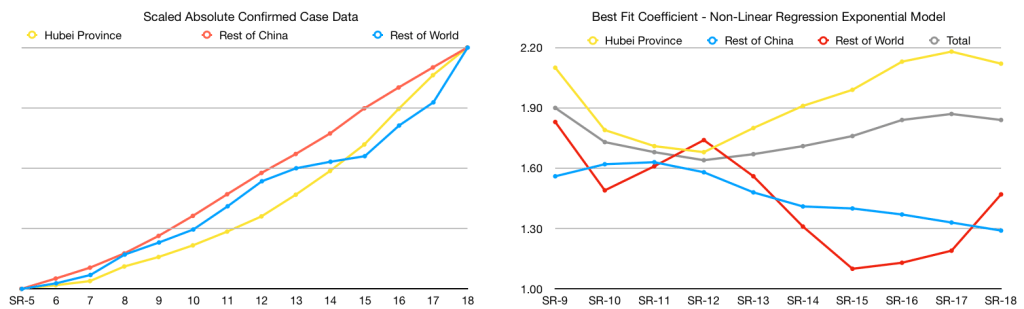
On right: change in the best fit non-linear regression curve exponential co-efficient. (Or: change in the rate of change.)
In both cases: up is worse, down is better.
Things stopped continuing in a consistent direction in every model today, which is, in my mind actually good news since most of them were getting worse. When the models move in small directions, but do so consistently, it worth tracking as a potentially a concrete steady change in the situation. When models move around by small amounts inconsistently, it’s more safe to discount the movement as noise. We’ll hope to see things move up and down at about the same rate if the model is stable, or start to fall consistently if indeed the situation is decelerating.
Hubei Province
Today’s situation report shows the first good news in awhile for Hubei Province. Today’s model shows a deceleration of the exponential growth rate compared to the yesterday’s rather than continuing to show further acceleration day by day. Unfortunately this could mean one of three things, the last possibility being least good:
- The change in growth rate is stabilizing or slowing.
- This is a blip and we’ll see continued uptick tomorrow.
- Hubei Province’s healthcare system is overwhelmed and unable to confirm all the cases that are coming in.
While the second situation will show itself true or not in the next few days, it’s going to be hard to disambiguate between the last and first situations if it’s one of those. One way to try and figure it out is a bit of a desperate assumption we can make: which is that it’s easier to count fatalities than confirm live cases. If we see no slowing of the growth rate of the best fit exponential curve in the death rate, but a slowing of the exponential curve in the confirmed case rate, the last situation may be more likely than the first.
Frustratingly this isn’t really a great approach either, since the count of fatalities counts the rate of acceleration at the end of 2019-nCoV cases while the confirmed case count tracks the rate of acceleration nearer to the beginning of the cases. Which means if things really are settling down to a stable curve (or… perhaps even decelerating) we would not expect the fatality count to show this trend for a number of days yet.
The best approach may be to mix some knowledge of on the ground anecdotes to understand whether the health system feels more overwhelmed than in previous days and whether case count confirmation is seeing a significantly higher backlog to understand whether the last situation might need real consideration. Unfortunately there’s no great way for me to get data on this that I’ve found. And there’s no mention of what the on the ground situation is looking like in the WHO situation reports.
Rest of World
China outside Hubei Province continues to show a slight decrease in the best fit exponential curve. This continues to be consistent with a hope that the response in China outside Hubei Province is working. A friend of a friend reports that two other provinces went under quarantine restrictions recently. News reports several more. It appears China is continuing to curtail travel between provinces. There’s not much to do here other than note this is one of the few populations showing sign of an effective response to the outbreak and wait and see if it continues.
Now let’s talk about the Rest of World outside China:
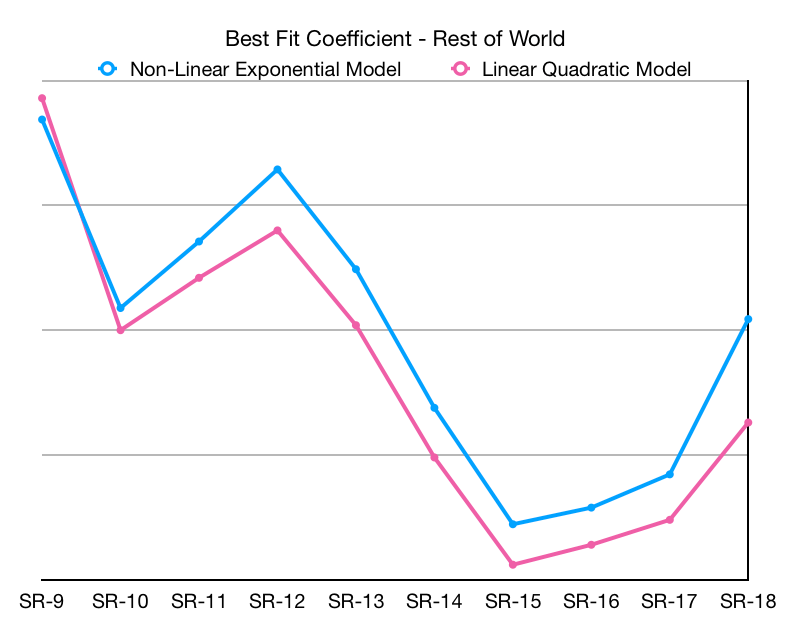
This looks real bad. But luckily it isn’t as bad as it looks. The majority of the spike here is from the confirmed case counts from one cruise ship as 41 new cases were confirmed there today. The fact that it happened to be included in the reporting on this day is not really significant. And the situation on the cruise ship seems unique enough to not necessarily say much about how we’re handling the spread of 2019-nCoV elsewhere. After this batch of cases are added to the count, over 20% of all the global cases outside China are on this one cruise ship.
So, let’s not generalize too much from this data and its change. That said, if you do eliminate today’s influx from the cruise ship you still see an increase in the model about in line with the changes in the past days, so the cases outside China do still appear to be accelerating. Perhaps in future days we will remove the cruise ship from counting as part of this population and leave it just in the totals. (Forking a whole separate population to monitor one ship seems overmuch?)
Key Numbers
I did this table yesterday, I think I’ll keep updating it for a bit:
| Number | Today | Yesterday | Last Week |
|---|---|---|---|
| Hubei – Half Pop (Months) | 14 | 13 | 36 |
| Hubei – Exp Co-Eff | 2.12 | 2.18 | 1.71 |
| Rest of China – Exp Co-Eff | 1.29 | 1.33 | 1.63 |
| Rest of World – Exp Co-Eff | 1.47 | 1.19 | 1.61 |
| 6 month fatality prediction | 61,619 | 60,677 | 42,521 |
Exp Co-Eff -> The co-efficient of the exponential term of the best fitting curve. (The rate of the rate of change in the models.)
6 month fatality prediction: again, it is important to state that this assumes no treatment intercept
