Some highlights today:
- The situation appears to continue to accelerate in Hubei Province.
- The situation outside Hubei Province, but inside the rest of China is not accelerating.
- The situation appears to be significantly improving outside of China. The Rest of World model is no longer a good match for an exponential growth rate. A linear regression now shows a much closer match to a linear model.
- There was no sign of weekend slowdown in data reporting. It increasingly appears the slowdown we saw yesterday is accurate.
Hubei Province
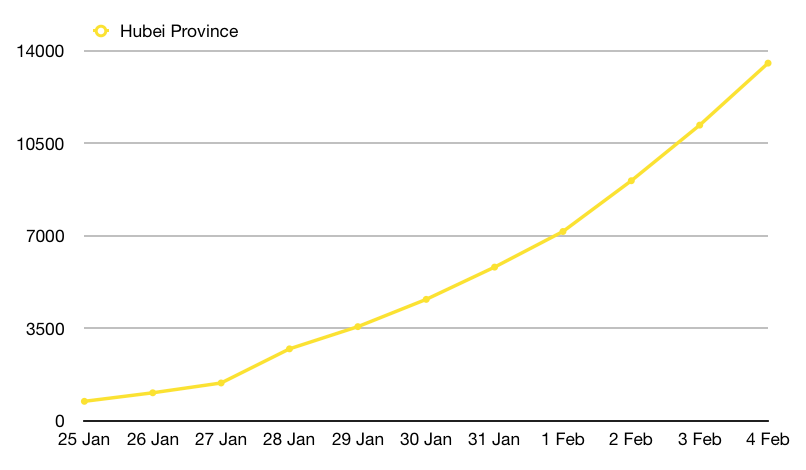
The spread of 2019-nCoV in Hubei Province continues to accelerate. It’s not just that there are more cases and the cases are growing exponentially, it is also that we are seeing an increase in the severity of the exponential curve. Under an exponential growth model, yesterday’s data has an exponential co-efficient of 1.91. Today’s non-linear regression to an exponential model finds that a curve with a 1.99 co-efficient is the best match. For the last three days, the co-efficient has been moving upward at about 0.1 a day.
This is… not great. Something I haven’t discussed yet is that I also ask my computer to use these models to generate, for each population I model, how long it would take 2019-nCoV to spread to half the population. There’s definitely some naive assumptions involved, since people gain immunity after being exposed and fighting off the infection. These people slow the growth rate some, and the model doesn’t include that. (Which is one of the reasons I don’t even ask it to go beyond 50%.) And even putting that aside, one thing we know is that by the time you go that far into the future your model will look different, so these numbers don’t have very much certainty. But they aren’t… entirely worth discarding and I think it’s time to start talking about what this model currently shows for Hubei Province. At least as a point of comparison to understand what these small changes in co-efficients mean for the overall trend.
Today’s model estimates that at this growth rate, 2019-nCoV would spread to half of Hubei’s population in 18 months. (The population of Hubei Province is around 58.5 million people.)
For a point of comparison, yesterday’s model, with its co-efficient of 1.91 instead of 1.99, predicted that the same thing would take 21 months. Which is an unpleasant change for one addition day’s worth of data. Especially when after Situation Report 12, only 3 days ago, the same prediction was 39 months.
Since these numbers are pretty stark I think it’s worth pointing out that these models are delayed from what’s actually going on in Hubei Province today. While this is the latest data on case numbers, we suspect 2019-nCoV has an incubation period of up to two weeks. The local quarantine and response may be more effective today than what we’re seeing in the numbers now. Our numbers today are measuring how effective the response was potentially up to two or three weeks ago. I think we can all agree that Hubei Province is taking 2019-nCoV even more seriously in the last weeks. Two entire dedicated hospitals have been built from the ground up in that time, after all.
On the other hand. The problem with exponential curves is that your response has to scale exponentially just to keep your current response level. For instance yesterday when the 1,000 bed Huoshenshan Hospital opened, 2,103 additional 2019-nCoV cases were confirmed in previous 24 hours in Hubei Province. On Thursday, when the 1,500 bed Leishenshan Hospital will open, the current model predicts an additional ~2,600 cases will be confirmed that day. It’s a tricky balancing act that public health professionals navigate in every outbreak. Previous outbreaks have shown that the people who do this can be quite good at it, and have a track record of moving fast enough to win. Though admittedly, most of this track record is for outbreaks that were smaller at their peak than this one is now.
Seemingly Incredibly Effective Containment
While the situation in Hubei Province is the bad news. The other parts of the report actually contain quite a bit of good news for the rest of the world. In the midst of an increasingly difficult crisis in Hubei Province, the exponential co-efficient for the Rest of China is holding steady. In fact, it actually dropped ever so slightly from yesterday.
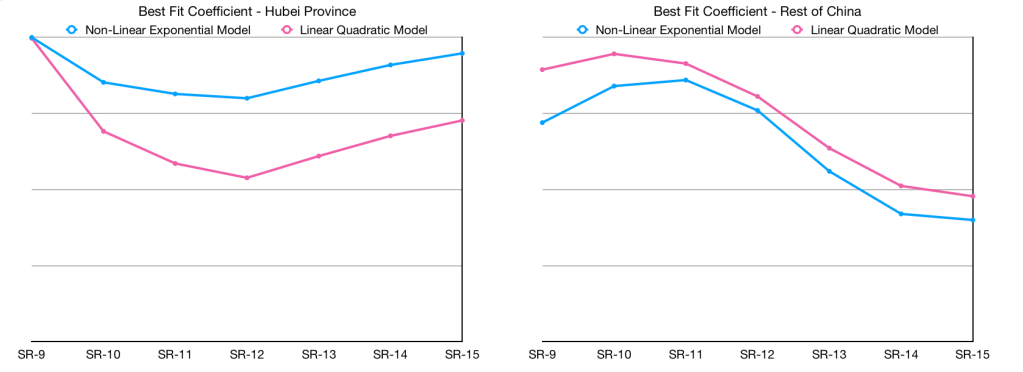
This seems pretty incredible to me. It shows that despite the situation in Hubei, the remaining provinces are able to scale their response appropriately. It also shows the effectiveness of the travel and quarantine restrictions currently imposed on movement in and out of major cities and transit links going in and out of Hubei Province. While there’s a broad variety of feelings on the way the Chinese government runs the country, I think it is not out of line to say that we are pretty fortunate that this outbreak happened in a country which can take such dramatic containment action while generally receiving solidarity and support from their population. The few Chinese citizens I know have generally spoken well and positively of a number of the government’s actions here, and the data certainly supports the effectiveness of efforts to contain the spread of 2019-nCoV inside of Hubei Province to that area.
On an international level, I think we are also lucky that this happened in a city where there are good sequencing and testing labs specifically for novel viruses. This allowed the world to become aware far earlier than usual and has, given what we currently see in the reported case data outside China, effectively allowed other countries to take action to prevent a broad spread of 2019-nCoV outside of China. The travel restrictions, at least the moment, appear to be working. It is ironic that good early response to the outbreak by China has unfortunately put them in a situation where they are more alone in fighting this issue than if they had caught it later, but the rest of the world should be very thankful they acted quickly.
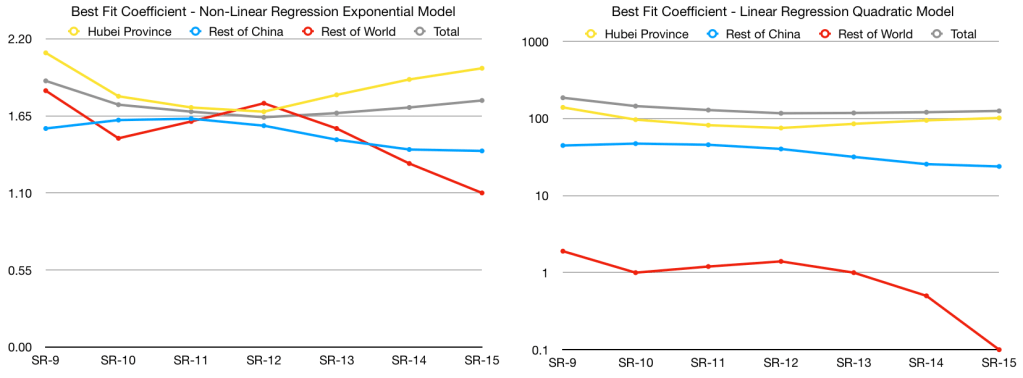
On a math perspective, there’s parts of this all that is pretty incredible. The exponential models show increasing divergence between the populations, suggesting successful containment between them. In the Rest of World population, the exponential model’s co-efficient is down to 1.10, which means we’re close to a point where the spread rate is no longer fitting exponential curve. For once, we’re also going to look at the quadratic model, which has gone so far to knock the co-efficient on the exponential term down to 0.1 and nearly zeroing it out to leave the linear term’s co-efficient as the main thing driving the model.
Unfortunately while this is amazing, we should not get too comfortable yet. The situation in China, even outside Hubei Province, remains exponential and a significant issue that will take substantial resources to respond to. The situation inside Hubei Province is even more difficult. While the divergence of the models show containment and isolation are so far proving effective, containment strategies can be fragile. If the situation in Hubei or the Rest of China advances, maintaining containment may become increasingly difficult.
It also isn’t a long term strategy. Containment means isolating these populations from the rest of the world. That’s usually okay to do in response to an outbreak for a limited timespan, but there’s a time limit on how long it’s morally or ethically acceptable, even assuming a community with a broad support for solidarity and bold public health actions. The general strategy is to do this only while you are actively engaged in trying to effectively diminish and eliminate the outbreak among a group of people, or until an effective treatment or vaccine arrives.
This is something we’re going to probably end up mentioning again in future days. The point of all these models ultimately really aren’t about letting 2019-nCoV run through any subset of any community and go away on its own. They’re ways of estimating how effective we’re being at slowing it to gain time, and how effective we are at containing the outbreak from a wider spread pandemic. And for the most part, with something this widespread, the goal probably isn’t to eliminate it through contact tracing and isolation alone. The goal is to keep things moving slow enough that more and more people have more and more time to wait for a treatment option to successfully be used and/or a vaccine to become available that can be used to provide resistance to the remainder of the population.
Biologists are already hard at work on the vaccine. And doctors are trying various combinations of anti-virals to help discover which ones are more effective. Both are important measures. Once we find out what to make, there’s going to be another logistical challenge in producing it at scale, as quickly as possible. But this is something our public health officials, in each country and worldwide, have plans to do in outbreaks and pandemics; present, future, & past.
This is why, for the most part, it doesn’t make a lot of sense to run these models more than 6-24 months in the future. There’s very few people in the public health community who expect to live in a world where we won’t have different tools and options available for 2019-nCoV by then.
Science is pretty amazing.
Remember to thank your local and global public health officials, biologists, and medical professionals.
On a lighter note
Yesterday I made the following claim:
This suggests that in the Rest of World population, what seems like a divergence in spread rate may just be partly explained by more doctors offices and testing labs being closed on the weekends. If I’m wrong, we’ll see this persist in tomorrow’s report and we’ll be able to hopefully confirm this isn’t an artifact. If I’m not, we’ll see a spike on this chart again tomorrow, just like we saw coming out of last weekend.
From Yesterday’s post on Situation Report 14
We did, of course, not see a spike in today’s data. And in fact saw the decrease in spread rate continue to not only persist, but decrease further. I’m thrilled to be wrong about the weekend potentially impacting our data and models yesterday. It turns out the data was accurate and there’s no evidence of underreporting due to the weekend.
