Some highlights today:
- Continued evidence of the following:
- The situation outside of China is slowing.
- The situation inside China, outside of Hubei Province is slowing.
- The situation in Hubei Province is accelerating.
- This situation report was compiled from data over a weekend. This may mean the above conclusions are less reliable.
- A digression to affirm that there’s no current support in the data I can see for the claim that 2019-nCoV cases are being covered up.
Containment Effectiveness
As part of the situation reports, the data reported by each country and broken down by province in China may be useful in evaluating the effectiveness of containment measures like travel restrictions and screening. We do this by examining the difference of the rate of growth between:
- The population in Hubei Province
- The population in the Rest of China, outside Hubei Province
- The population in the Rest of the World
If the city wide quarantines and intra-country travel restrictions between Hubei Province and the rest of China are effective, we should see a different rate of spread between the population of Hubei and the Rest of China.
If the international travel restrictions and screening are effective at containing 2019-nCoV mostly within China, we should also see a different rate of spread in the Rest of World population.

Luckily, we don’t have to rely on staring at superimposed lines on a graph and trying to figure out how “curve-y” something is to understand whether or not these things are that different from each other. We can, thankfully, quantify this and ask our computer to fit each of these datapoints to the best curve on an exponential model, and then look at the coefficient for the exponential part. The larger the coefficient, the faster the spread of 2019-nCoV cases in that population. The smaller, the slower. Small differences in the coefficient can make a large difference, because the model is exponential.
Here’s are the coefficients computed across the data in Situation Reports 5 through 14:
- Hubei Province:
1.91 - Rest of China:
1.41 - Rest of World:
1.34
Note: these coefficients are not the same thing as
R0(Pronounced R-Naught), which has been discussed a bunch elsewhere and is an epidemiology concept. They are correlated but the values are not comparable. We don’t know what the finalR0for 2019-nCoV is yet.
As you can see. At the moment we’re seeing significantly different rates of spread outside Hubei Province than we are inside. And as we’ll get to in the next section, over the last few days, these rates have continued to diverge. This suggests that the containment measures are allowing the response in those areas to be increasingly effective.
Response Effectiveness
The health professionals involved in the response to lessen the spread of 2019-nCoV are nothing short of heroic, especially in Hubei Province where the situation is furthest advanced. The professionals working to treat those who have it, test suspect cases, advise quarantine and isolation where appropriate, and perform contact tracing to find other suspected cases are doing amazing work. Nothing in this section is about whether or not they’re doing a good job. They are.
The question is whether or not 2019-nCoV in a specific region is currently moving faster than the response efforts can keep up. We can also see evidence for or against this proposition based on statistical modeling. We can do curve-fitting again across the data we have and show how each report changes the curve we get. This gives us an idea whether the situation is slowing, indicating an effective response. Or increasing, indicating a response that is becoming less effective as the virus spreads.
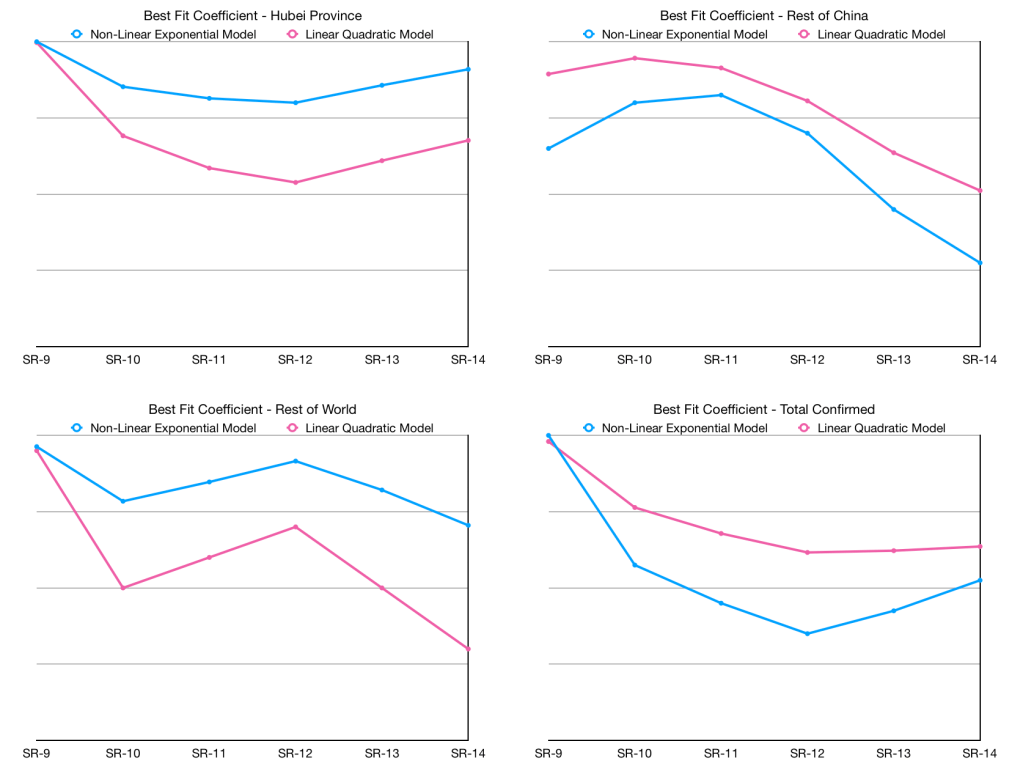
Let’s take the graph of the situation in Hubei Province on the top left first: After seeming improvement last week, the spread of the virus appears to be accelerating with these latest two datapoints. It’s not as dire as it looked in Situation Report 9, but it’s headed back up in that direction. The incredible response in Hubei Province, including building two separate hospitals in eight and ten days respectively, currently isn’t slowing down 2019-nCoV in that region. (The hospitals hadn’t opened yet though! One opened yesterday for the first time, the other is scheduled to open tomorrow, assuming construction complete on time.)
The better news is that the response to 2019-nCoV in China outside Hubei Province and in the Rest of the World both show downward trends and a slowing of the rate of spread. It is, admittedly much easier do this early on when there’s fewer cases to handle. But it does show that the level of response elsewhere is currently leading to a slower spread of those clusters.
Caveats
So. The reality is that a lot of professionals in a lot of countries take weekends off. There’s nothing wrong with that, but it may also be showing up in our data. Let’s talk about that for a moment:


There is, unfortunately on this graph, an acceleration that happens to be right after a weekend ends (reporting is one day delayed) and a corresponding deceleration going into the next weekend. This suggests that in the Rest of World population, what seems like a divergence in spread rate may just be partly explained by more doctors offices and testing labs being closed on the weekends. If I’m wrong, we’ll see this persist in tomorrow’s report and we’ll be able to hopefully confirm this isn’t an artifact. If I’m not, we’ll see a spike on this chart again tomorrow, just like we saw coming out of last weekend.
In comparison, you can see similar, but a more minor thing potentially happening in the Rest of China chart. The Hubei Province chart on the other hand, is full steam ahead through the weekend, which probably is accurate for how the healthcare system is working there right now:
Brief Debunking Attempt
The Internet is current rife with claims that China is keeping data back here. This is in stark contrast to the WHO reports which regularly thank the various governments involved for their cooperation and openness in data sharing. But can we use the data to also decide whether there might be a bias in the data reporting?
Obviously there’s limits on how much we can use a datasource to prove itself flawed or not. If the datasource is completely compromised it would be possible to make it flawed in a way resistant to statistical analysis. But there’s a bunch of people independent generating data for these reports and it seems fair to assume the coordination problem of making sure the rate at which each person in charge of filing these reports hides them to produce a correct statistical outcome… is probably not the top thing on the agenda in China right now.
So, I think it’s safe to assume that if reports were being hidden, we would likely see some divergence in the curves for the death rate and confirmed case rate. After all, hiding a death is not the same as hiding a case confirmation report. Assuming there’s any level of effort difference here, we’d expect that an active attempt to hide data would show up as a divergence in these rates.
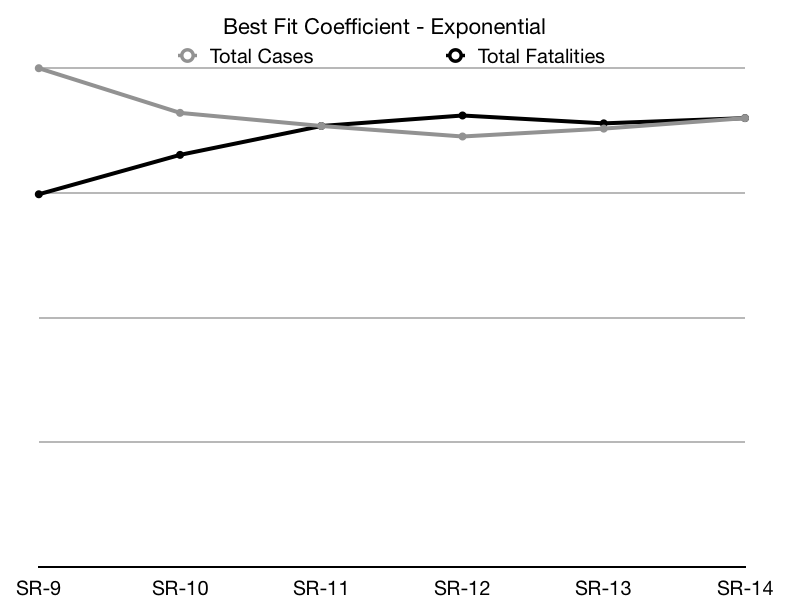
We see no evidence of that here. Ever since the data in Situation Report 11, the exponential curve fit for confirmed case growth and fatalities have matched with surprising accuracy. My models before Situation Report 11 (labelled SR-11 on this graph) were frankly unstable and operating without many datapoints. I’m not surprised there’s some small divergence there, and would in fact be more concerned if there wasn’t! (Then there’s a case to be made that the numbers were too perfect and maybe there really were cooked books. This imperfection seems just right.)
This provides additional evidence that there’s no widespread attempt to hide 2019-nCoV data.
We may review this chart in the future, because it would also be where we would see the first sign of an overloaded healthcare system. If we see divergence in this graph in a later stage, it may be a sign that the situation is moving too fast for the local healthcare system to accurately confirm new suspect cases. In these cases, the healthcare systems can often remain accurate counting fatalities for a longer period of time, and we’d see a divergence appear on this graph.
Correction: Approximately 4 hours after this post, the World Health Organization re-issued 2019-nCoV Situation Report 14 fixing a transposition error in one of their tables. The impact to the charts above is minimal and the change only strengthens the speculation above. But for the record, the corrected Rest of World co-efficient at the bottom of the Containment Effectiveness section is
1.31and not1.34as listed.
